Visualizing data with Sparklines.
In the world of data analysis, visual representation is key to understanding trends and patterns quickly. Microsoft Excel offers a powerful yet often underutilized feature called Sparklines. These tiny, cell-sized charts provide a compact and immediate visual summary of data trends, making them an invaluable tool for anyone working with data.
What Are Sparklines?
Sparklines are miniature charts that fit within a single cell in Excel. Unlike traditional charts, they are designed to be embedded within the data itself, providing a quick visual representation without taking up much space. Sparklines can be used to show trends, variations, and patterns in a series of values, making them perfect for dashboards and reports.
Types of Sparklines
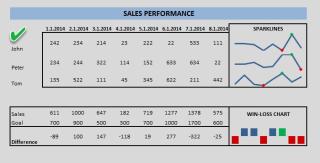
Excel offers three types of Sparklines:
- Line Sparklines: These are used to show trends over time. They are ideal for displaying continuous data, such as monthly sales figures or stock prices.
- Column Sparklines: These are used to compare individual values. They are perfect for showing discrete data points, such as the number of units sold each quarter.
- Win/Loss Sparklines: These are used to show binary outcomes, such as wins and losses in a series of games. They are great for highlighting positive and negative values.
How to Create Sparklines
Creating Sparklines in Excel is straightforward:
- Select the Data: Highlight the range of data you want to visualize.
- Insert Sparklines: Go to the Insert tab on the Ribbon, and choose the type of Sparkline you want to create (Line, Column, or Win/Loss).
- Specify the Location: Select the cell where you want the Sparkline to appear.
- Customize: Use the Sparkline Tools on the Ribbon to customize the appearance, such as changing the color or adding markers.
Customizing Sparklines
Excel provides several customization options to make your Sparklines more informative:
- Markers: Highlight specific data points, such as the highest or lowest values.
- Color: Change the color of the Sparkline to match your theme or highlight certain trends.
- Axis: Add an axis to provide context for the data values.
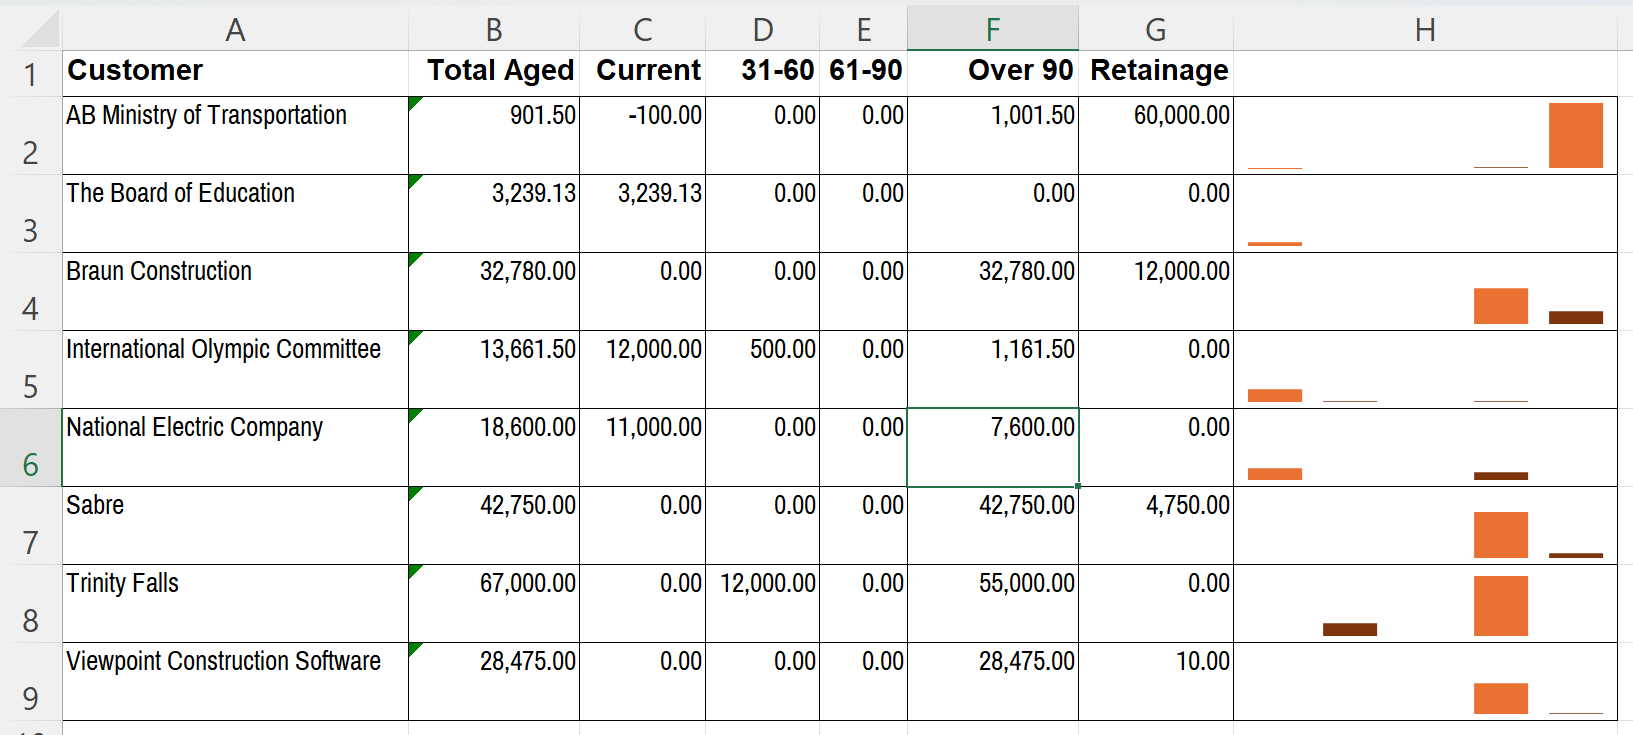
Example:
Here I've quickly pulled a sample AR Aging from Vista and applied some sparklines in Excel. It's very easy to see how the agings are spread using this visualization.
Conclusion
Sparklines are a powerful tool for anyone looking to enhance their data analysis and reporting. By providing a quick and easy way to visualize trends and patterns, Sparklines can help you make more informed decisions and communicate your findings more effectively.
Sparklines are available not only in Excel but also in PowerBI and SSRS reports. SSRS reports are fully supported in Vista and VistaWeb. If you would like to take your functional Vista reports to a new level by applying visualization techniques to them, reach out to us and we would love to discover how to transform your plain data into powerful and actionable visualizations.